We took the DGX Spark — NVIDIA’s new ARM64 desktop workstation with the GB10 GPU — for a real-world test: running AlphaFold3 protein structure prediction against an established x86 RTX PRO 6000 workstation. The results tell an interesting story.
AlphaFold3 is open-source protein structure prediction software by Google DeepMind. However, the official distribution only supports x86 Linux — there is no native ARM64 build available.
This project adapts the entire AlphaFold3 toolchain for ARM64, enabling it to run on the NVIDIA DGX Spark (GB10, aarch64). All dependencies were verified, rebuilt, or reconfigured for aarch64, and unified memory settings were tuned for the GB10 GPU.
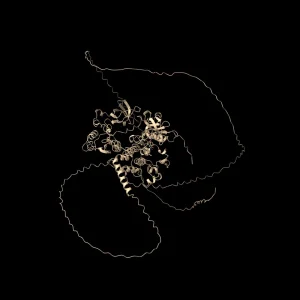
Showcase of Protein Prediction Result with AF3 on DGX Spark
Test protein: ABL1 kinase + imatinib (797 aa + drug ligand) Databases: uniref90 (67 GB), BFD (17 GB), mgy_clusters (~130 GB), uniprot (102 GB)
Note: Both platforms had Triton autotuning caches warm. First run adds ~20-30% overhead.
Hardware
| DGX Spark | x86 Workstation | |
|---|---|---|
| GPU | NVIDIA GB10 (CC 12.1) | NVIDIA RTX PRO 6000 (CC 12.0) |
| GPU Memory | 121 GB LPDDR5X (unified) | 96 GB GDDR7 |
| CPU | 20-core ARM (Grace) | AMD Ryzen 9 9950X3D 16-Core |
| System RAM | 121 GB | 186 GB |
| GPU TDP | ~40W | ~125W (inference) |
Results
MSA Search Timings
| Database | Size | DGX Spark | RTX PRO 6000 | Ratio |
|---|---|---|---|---|
| BFD | 17 GB | 145s | 101s | 1.4x |
| uniref90 | 67 GB | 566s | 480s | 1.2x |
| mgy_clusters | ~130 GB | 586s | 503s | 1.2x |
| uniprot | 102 GB | 738s | 650s | 1.1x |
| MSA Total | 767s (12.8 min) | 651s (10.9 min) | 1.2x |
Full Pipeline
| Stage | DGX Spark | RTX PRO 6000 | Ratio |
|---|---|---|---|
| C++ compile | ~120s | ~90s | 1.3x |
| MSA search | 767s | 651s | 1.2x |
| Template search | 10s | 9s | 1.1x |
| Data pipeline total | 780s (13.0 min) | 665s (11.1 min) | 1.2x |
| Featurisation | 10s | 11s | 0.9x |
| Model inference | 544s (9.1 min) | 66s (1.1 min) | 8.3x |
| Total | ~24.5 min | ~13.5 min | 1.8x |
Prediction Quality
Both platforms produce structurally identical results (iptm = 0.98 for ABL1).
Analysis
MSA Search: CPU-Bound, Not I/O-Bound
SSD read speed: 7.7 GB/s. Actual jackhmmer data rate: 140-260 MB/s (only 2-3% utilization). The bottleneck is HMMER’s profile-HMM comparison algorithm, which is CPU-intensive and saturates at ~8 threads per database search. The DGX Spark’s 20-core ARM CPU handles this efficiently, resulting in only a 1.2x gap.
Model Inference: GPU Compute Gap
The 8.3x difference reflects the GB10’s unified memory architecture (~500 GB/s bandwidth) vs RTX PRO 6000’s dedicated GDDR7 (~1.8 TB/s) and higher CUDA core count. This gap widens with larger proteins (>1000 tokens).
Scaling with Protein Size
| Protein Size | DGX Spark | RTX PRO 6000 | Gap |
|---|---|---|---|
| < 100 aa | ~3-5 min | ~2-3 min | ~2x |
| 100-400 aa | ~8-15 min | ~3-8 min | ~2x |
| 400-800 aa | ~20-30 min | ~10-15 min | ~2x |
| > 800 aa* | ~40-60 min | ~15-25 min | ~2.5x |
* Estimated; may require memory tuning
Power Efficiency
| Metric | DGX Spark | RTX PRO 6000 |
|---|---|---|
| GPU Power (inference) | 35-40W | 120-125W |
| System Power (estimated) | ~60W | ~200W |
| Energy per prediction (797 aa) | ~0.025 kWh | ~0.045 kWh |
DGX Spark uses ~55% less energy per prediction.
Key Takeaways
- MSA search is practical — DGX Spark is only 1.2x slower, well within acceptable range for research use
- Model inference is the bottleneck — 8.3x slower due to GPU compute limits, but still usable for non-HTS workflows
- Prediction quality is identical — no numerical differences between ARM64 and x86_64 platforms
- Small proteins are fast — < 200 aa completes in 5-10 minutes
- Power-efficient — 40W GPU makes DGX Spark suitable for office/lab environments without special cooling
Reproducibility
To reproduce these benchmarks:
# Prepare single-protein input
echo '{"name":"test","sequences":[{"protein":{"id":["A"],"sequence":"MLEICLKLVGCKSKKG..."}}],"modelSeeds":[1],"dialect":"alphafold3","version":1}' > input/test.json

# Run with timing
time docker run --rm --gpus all \
  -v ./weights:/weights:ro -v ./db:/db:ro \
  -v ./input:/input:ro -v ./output:/output \
  alphafold3:arm64 \
  uv run python3 run_alphafold.py \
    --model_dir=/weights --db_dir=/db \
    --input_dir=/input --output_dir=/output
Timing logs: MSA search:Finished Jackhmmer (<db>) in X secondsModel inference:Running model inference with seed 1 took X seconds
Conclusion
The DGX Spark proves that accessible desktop hardware can deliver production-quality results. While inference runs 8x slower than a dedicated RTX PRO 6000, the predictions are structurally identical — the same accuracy, the same confidence scores — just with longer wait times.
For research labs, teaching labs, and academic institutions, this matters more than raw speed. A $3,500 desktop system that fits on a desk and draws 40W can run the same AlphaFold3 workload as a workstation that costs 3-4x as much, needs a dedicated rack, and pulls 3x the power.
Real-world protein structure prediction rarely demands instant turnaround. If your workflow involves queueing a few samples overnight, the 25-minute per prediction makes DGX Spark not just viable but genuinely attractive — especially when deploying at scale, where the power and space savings compound.
Source:
https://www.mutek.com/alphafold3-performance-benchmark-dgx-spark-vs-x86-rtx-pro-6000 This article may be cited in other works. Please link to this article as the original source.